Manage Collected Data
The "Manage Collected Data" tab in the Survey Design module of the Chisquares platform provides a comprehensive overview and real-time insights into your survey’s progress, status, and response patterns. This feature is crucial for monitoring participation, evaluating multilingual response dynamics, and preparing your data for analysis.
This documentation outlines each component and how to use it effectively.
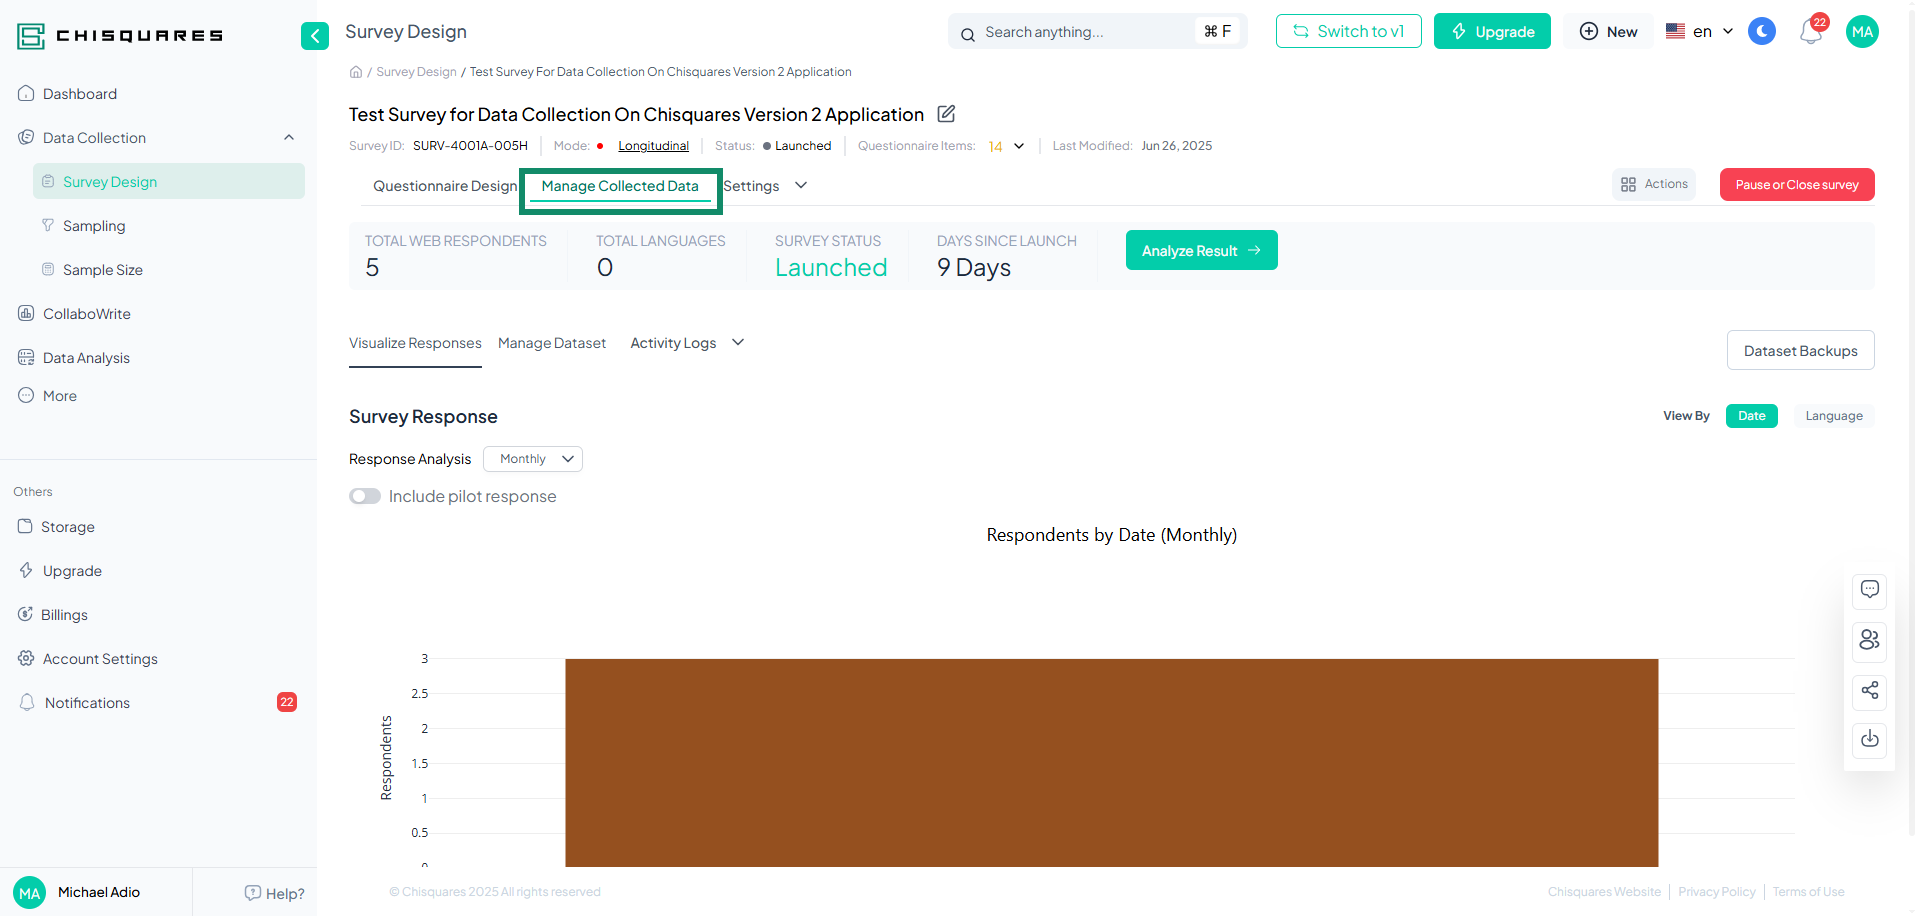
Interface Overview
When the "Manage Collected Data" tab is selected, the following key information and tools are displayed:
1. TOTAL WEB RESPONDENTS
- Definition: Displays the cumulative number of survey responses received through the web.
- Function: This count updates in real time, allowing you to monitor participation as it happens.
2. TOTAL LANGUAGES
- Definition: Shows the number of languages into which the survey has been translated.
- Function: Helps track the inclusivity and linguistic reach of your survey.
3. SURVEY STATUS
- States:
- Launched – The survey is currently live and collecting data.
- Pre-Launched – The survey has been prepared but has not yet been made available to respondents.
- Paused – Data collection is temporarily suspended.
- Function: Enables quick identification of the operational state of the survey.
4. DAYS SINCE LAUNCH
- Definition: Indicates the number of days that have passed since the survey was made live.
- Function: Useful for evaluating response trends over time and for campaign tracking.
5. Analyze Result (Button)
- Action: Redirect the user to the Data Analysis Module.
- Purpose: Allows users to perform detailed analysis of the collected data, derive insights, visualize patterns, and generate analytical reports.
Survey Response Visualization
Default Display
- The platform shows a graphical representation of survey responses by date, offering a timeline of data collection.
Dropdown: Response Analysis
- Options:
- Daily (default): Visualizes how many responses were collected each day.
- Weekly: Groups and displays response counts by week for higher-level trends.
View By:
-
Date (Button):
- Displays response trends across the duration of the survey in chronological order.
-
Language (Button):
- Allows the user to view responses by the language in which they were submitted.
- Provides insight into language-specific engagement and performance.
Interactive Graph Tools
When hovering over the graphical plots, an interactive toolbar appears with the following tools powered by Plotly.js (v2.35.3):
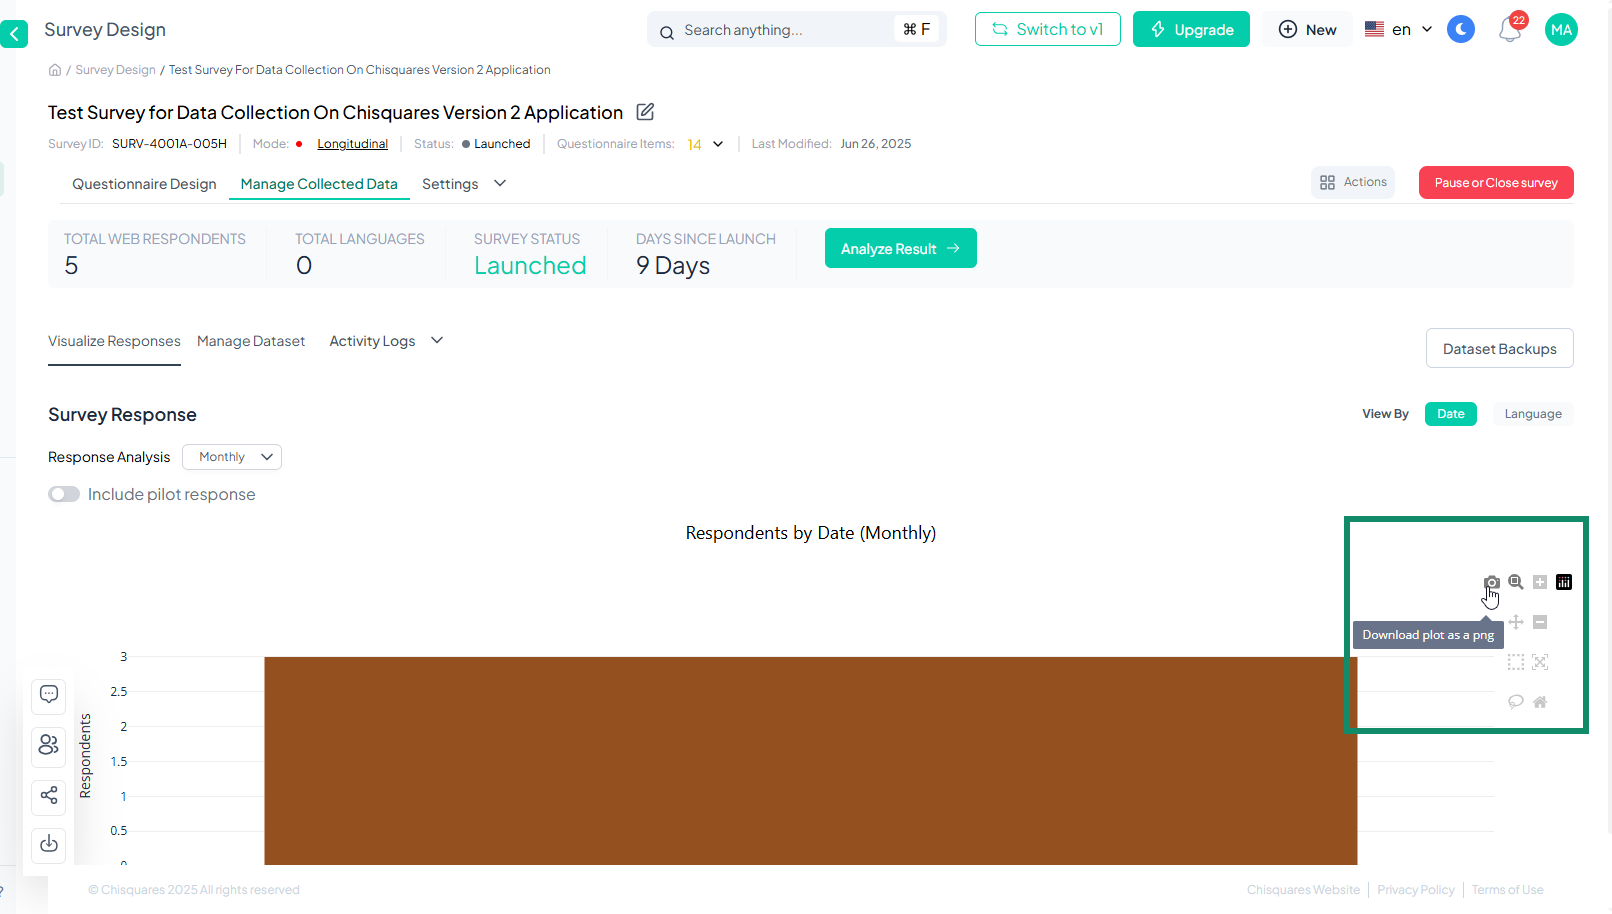
- Download plot as a PNG: Save the current visualization as an image for reports or offline analysis.
- Zoom / Zoom in / Zoom out: Adjust the focus area of the chart for detailed inspection.
- Pan: Move the viewable area of the graph to observe different data sections.
- Box Select: Draw a box to select and zoom in on a specific subset of data.
- Lasso Select: Freehand-select specific data points on the graph.
- Autoscale: Automatically resizes the chart to fit all data.
- Reset Axes: Returns the visualization to its original state.
These visualization tools enhance user control and exploration of response data, supporting clearer, data-driven decisions.
Summary
The "Manage Collected Data" tab is designed to provide real-time feedback and graphical insights into your survey’s performance. It serves as the bridge between data collection and analysis, allowing you to:
- Track participation across time and languages
- Assess the survey status at a glance
- Quickly navigate to data analysis
- Explore collected data visually with professional plotting tools
This feature ensures that users—from novice researchers to advanced analysts—can effectively manage and interpret their survey data within the Chisquares platform.


