Sampling
Sampling is crucial in research, balancing precision with practicality. Understanding sampling principles ensures meaningful and applicable findings. The Chisquares platform enhances study reliability and validity, offering features like Automatic Representative Sampling and Probability Sampling on a Sampling Frame. Here's a detailed guide on how to perform sampling.
Automatically Draw Representative Sample
The ability to automatically draw representative samples allows you to leverage the power of advanced algorithms to efficiently and impartially select samples that accurately mirror the characteristics of the larger population. This approach contributes to the scientific rigor of research studies and addresses threats to external validity that may arise from non-coverage bias.
Getting Started
To use the Sampling module effectively, follow these simple steps:
How to use Automatically Draw Representative Sample
-
Log in to your Chisquares account.
-
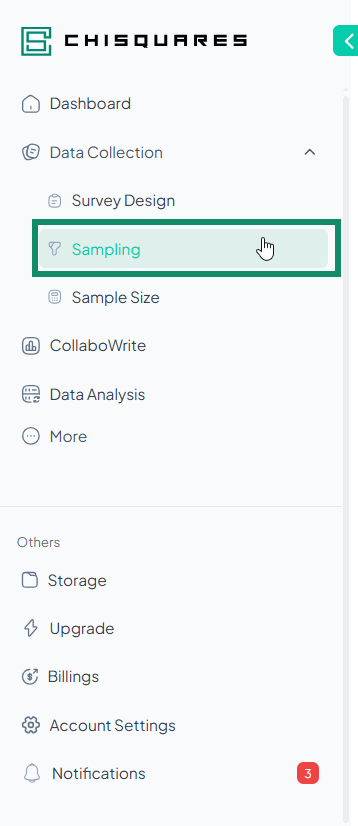
From the dashboard, click on Data Collection in the navigation bar.
-
From the dropdown, click on Sampling.
-
Click on Start New Sampling.
-
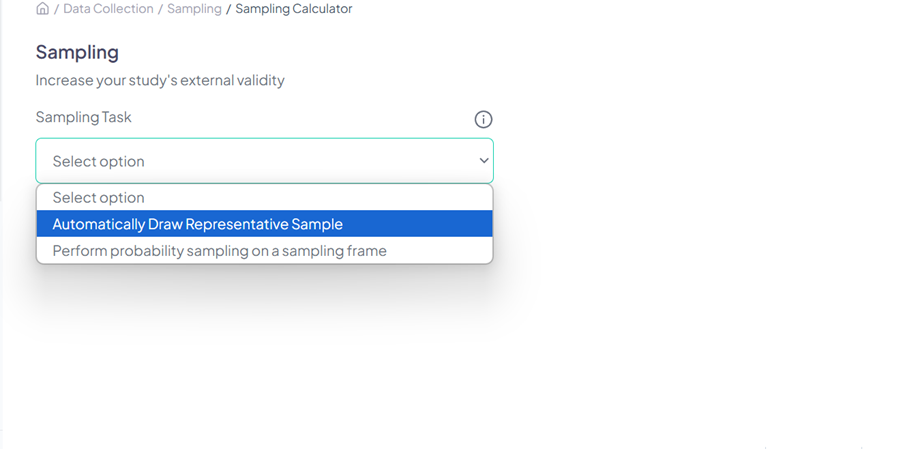
Select Automatically Draw Representative Sample as the sampling task.
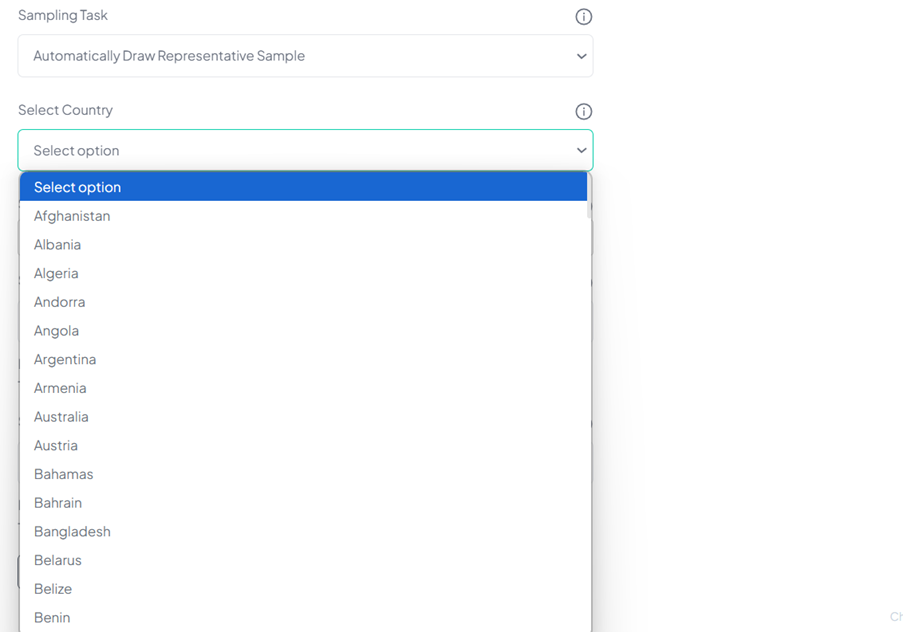
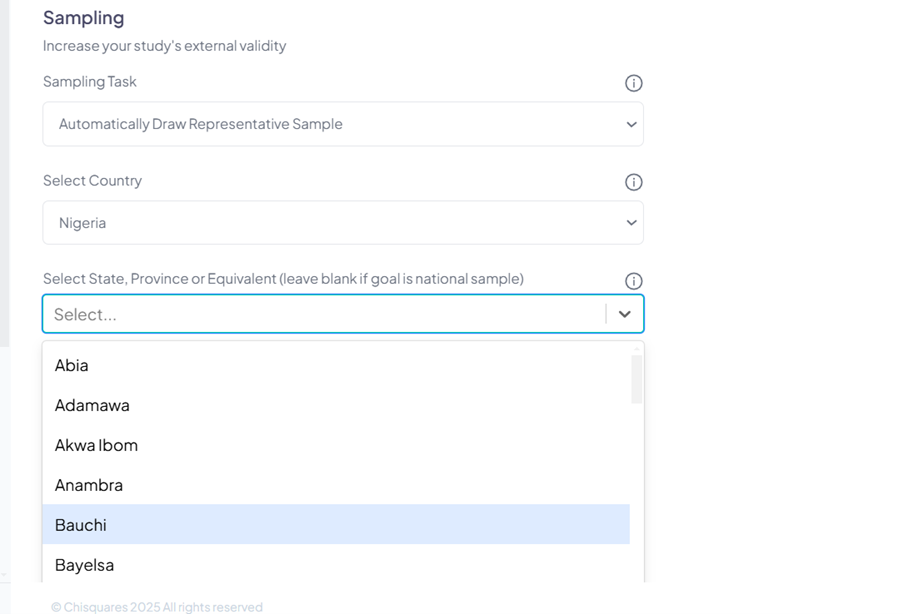
- Select the Country, State, or Province that you want to sample from.
- Choose the number of administrative divisions.
-
Input the number of clusters desired.
-
Input your desired sample size across the selected clusters.
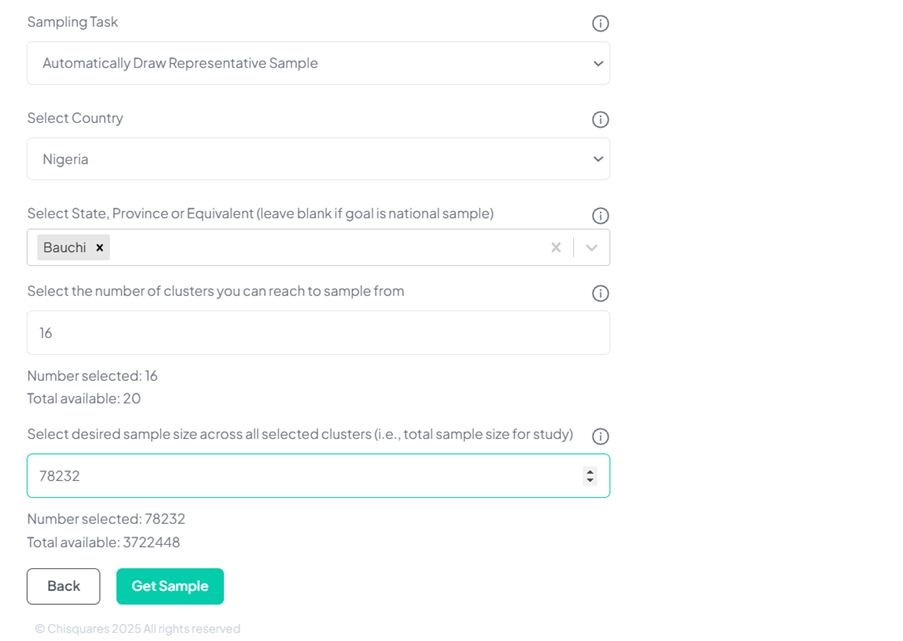
- Click on Get Sample to get the result either as a map or a table.
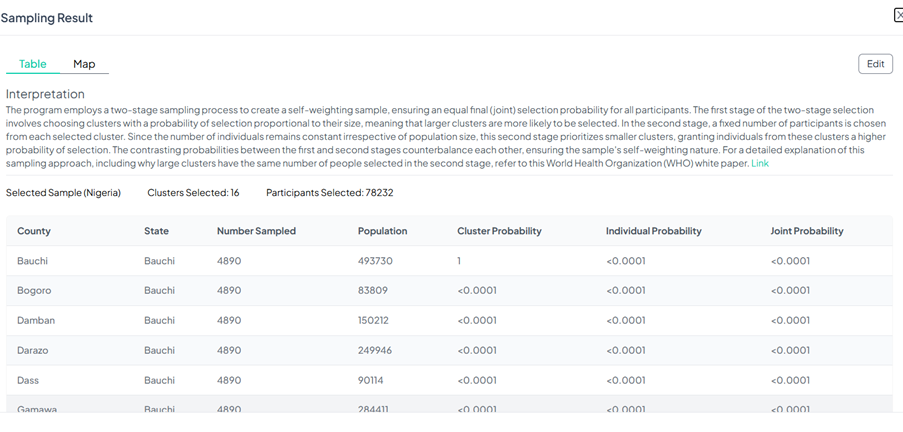
Result as table
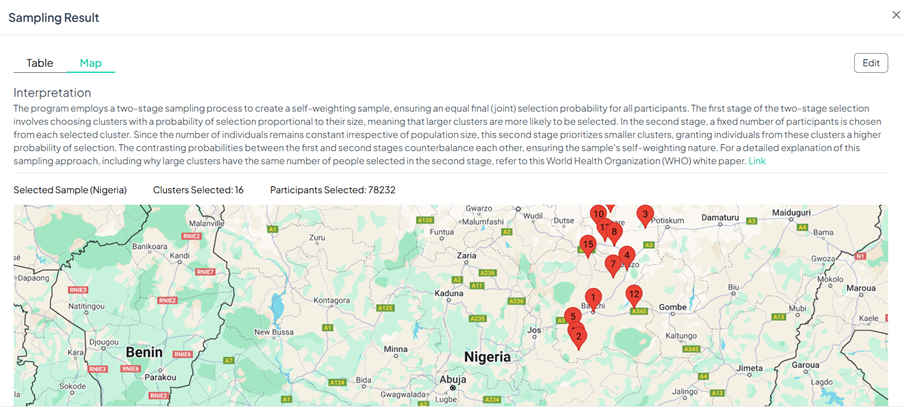
Result as map
Probability Sampling on a Sample Frame
-
Log in to your Chisquares account.
-
From the dashboard, click on Data Collection in the navigation bar.
-
From the dropdown, click on Sampling.
-
Click on Start New Sampling.
-
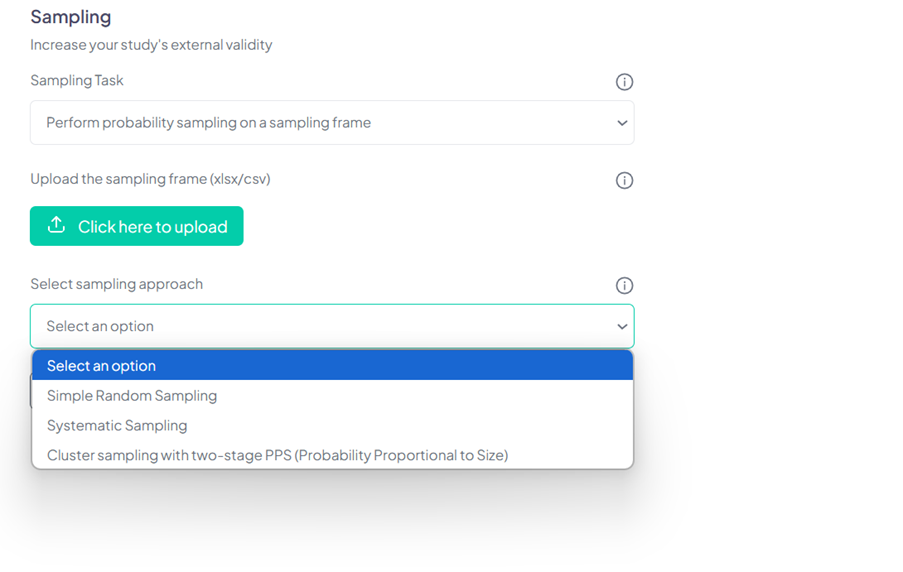
Select Perform Probability Sampling on a Sampling Frame.
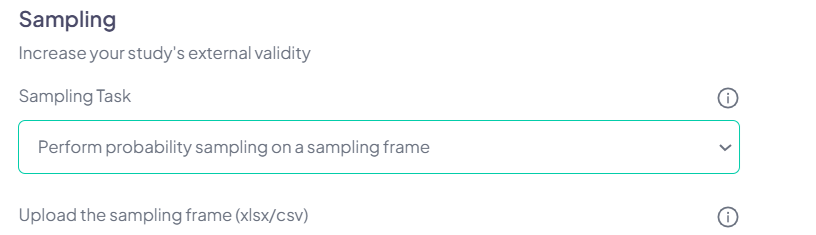
- Upload the sampling frame.
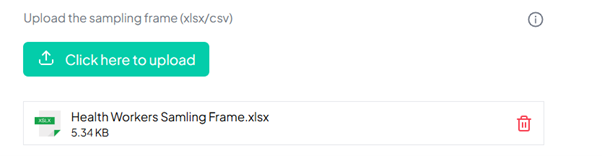
For simple random sampling, the IDs or names of the items to be sampled should be in a single column in your Excel spreadsheet. For systematic sampling, the IDs or names of the items to be sampled should be in a single column in your Excel spreadsheet. There should also be another column with the sorting variable with which to arrange the sampling elements before selection. For PPS sampling (i.e., sampling with the probability of selection proportional to size), the IDs or names of the clusters to be sampled should be in a single column in your Excel spreadsheet. There should also be another column with the measure of size for each cluster.
- Select the sampling approach (i.e. Simple Random Sampling, Systematic Sampling, or PPS sampling).
- Enter other input parameters for the desired sampling approach, as applicable.
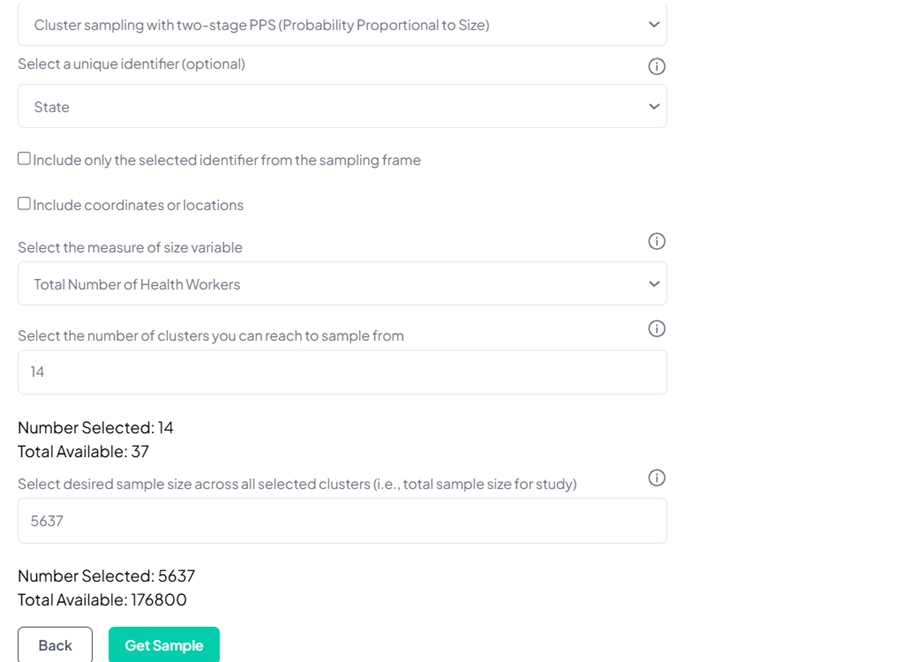
- Then click on the Get sample button to get the result to get the results in a tabular form.
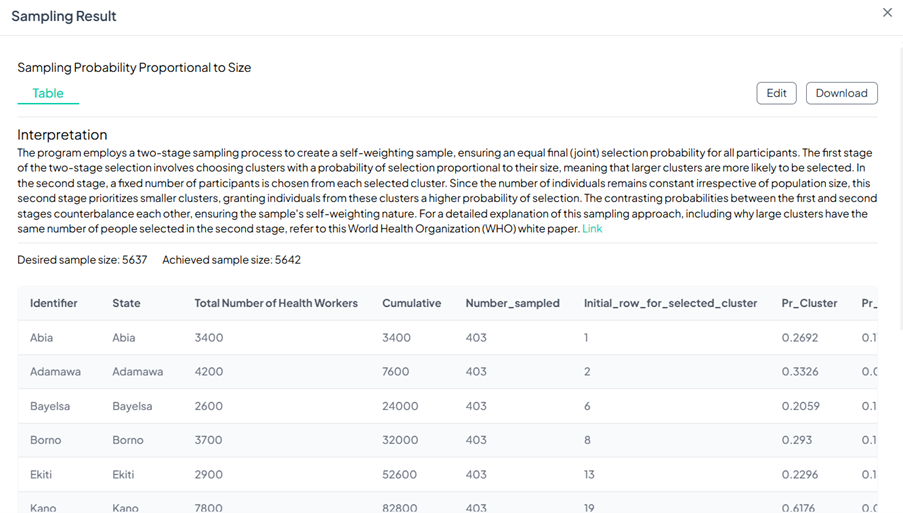
Click on Download to download the result on your device as a spreadsheet.
Additional Feature
- Information Tooltip ( ℹ️ ): Hover over the info icon next to the Sampling Task label for quick explanations of each option.
Best Practices
-
Ensure Data Completeness: Before using probability sampling, confirm that the sampling frame is well-structured and complete.
-
Choose the Right Sampling Method: Select representative sampling for general population studies and probability sampling for statistically rigorous research.
-
Validate Your Sample: Always review your sample distribution to ensure it aligns with study goals.
Conclusion
The Sampling module on the Chisquares platform provides robust tools for researchers to enhance study reliability. By leveraging automated representative sampling and probability-based selection, users can streamline the sampling process while maintaining methodological rigor.
For further assistance, access the Help? button in the lower-left for extended support.


